
Visible Language Workshop, Media Laboratory
Massachusetts Institute of Technology
20 Ames Street, Cambridge, MA 02139
ishi@media.mit.edu, suguru@media.mit.edu
This paper presents a reactive interface display which allows information
seekers to explore complex information spaces. We have adopted information
seeking dialogue as a fundamental model of interaction and implemented a
prototype system in the mapping domain--GeoSpace--which progressively
provides information upon a user's input queries. Domain knowledge is
represented in a form of information presentation plan modules, and an
activation spreading network technique is used to determine the relevance
of information. The reactive nature of the activation spreading network,
combined with visual design techniques, such as typography, color and
transparency enables the system to support the information seeker in
exploring the complex information space. The system also incorporates a
simple learning mechanism which enables the system to adapt the display to
a particular user's preferences. GeoSpace allows users to rapidly
identify information in a dense display and it can guide a users'
attention in a fluid manner while preserving overall context.
The exploration of complex data spaces in an age where both technology and
information are growing at exponential rates is a challenging task. Recent
developments in interactive media with high quality graphics have provided
interface designers a means of creating more comprehensive environments for
visualizing complex information. However, most interactive information
systems provide collections of discrete visual presentations, in that they
do not relate one presentation to another. Consequently, they fail to
support a user's continuous exploration of visual information and gradual
construction of understanding.
In order to create a more responsive visual information display, we have
focused on developing an interactive visualization system that embodies the
following characteristics:
Two main areas of research have influenced the work presented in this
paper. The first area of research involves visual techniques and direct
manipulation as a means of exploring complex information. One such approach
is the use of overlapping multiple layers of information in which
individual layers are accessible [3]. Belge et al. proposed a layering
system in which a user can select and pull out layers by directly accessing
visual elements on them. While their approach provided users with more
control over the composition of layers, it does not provide semantic access
to the information; nor does it visually organize the display. Colby et al.
proposed a multi-layer map composting system [5] where users specify the
importance of relevant information using sliders. Based on the importance
values, their system automatically adjusts transparency, focus, and
intensity of visual elements using simple rules encoded by a graphic
designer. Although their system allows users to focus on the semantics
(importance) of information rather than directly manipulating the graphics,
the interaction becomes cumbersome when the number of information layers
increases (i.e., the importance of each layer must be adjusted by the
user). Most multi-layer approaches provide users with an interface that
controls the display based on layers in order to simplify the interaction.
However, they only allow limited access to specific graphic components
within a given layer in order to avoid complex interaction.
While the above approaches emphasize direct manipulation and visual
techniques, other interface displays have been proposed that incorporate
domain and presentation knowledge (e.g.,[7][11][12]). For example, Maybury
introduces an interactive visual presentation method that considers visual
presentation as communicative acts (e.g., graphical, auditory, or gestural)
based on the linguistic study of speech acts [11]. A multimedia explanation
is achieved by using rhetorical acts, which is a sequence of linguistic or
graphical acts that achieve a certain communicative goal such as
identifying an information entity. Rhetorical acts are represented in a
form of a plan, which is similar to our representation. Although these
intelligent presentation systems enables sophisticated presentation based
on a user's single request, they do not provide a mechanism to maintain
a model of the user's information seeking goals from one query to
another.
In this paper, we propose an information visualization system based on a
model of an information seeking dialogue, where an information seeker
incrementally asks questions and an information provider gradually answers
the questions. Geographic information is chosen as an example domain which
involves highly complex information and it is used to illustrate the
proposed technique. Our ultimate goal is to apply this approach in various
other domains of complex information such as news spaces and other abstract
information domains.
In section 2, we describe an interaction model on which our system is
based. Section 3 presents a prototype system, GeoSpace, in the geographic
information systems domain. In Section 4, we outline our technical
framework for implementing GeoSpace. Finally, in section 5 we discuss
potential directions in which our research can be extended.
We have adopted information seeking dialogue as a fundamental model of
interaction, since the information space is hard to comprehend by a single
query [4]. Most users find it difficult to formulate their information
seeking goals in one request. Hence, an information display that gradually
augments this process would greatly enhance the user's comprehension.
Our interaction model based on our informal observation is as follows: The
first query by the information seeker (IS) makes the information provider
(IP) guess what is important to show. After the IP provides information
based on the first query, the IS may ask the second query based on what is
provided. The IP then determines what is important to show next considering
both the first and the second queries. The information seeking dialogue may
continue until the user is satisfied.
A user's information seeking process can be top-down, bottom-up, or a
combination of both. For example, suppose the IS is trying to look for a
new apartment. On one hand, the IS may start a dialogue by stating that
s/he is looking for an apartment. This can be considered top-down since the
IS provided the ultimate goal of the dialogue. In this case, the IP is not
certain about what kind of detailed information the IS is aware of. On the
other hand, the IS may ask for a particular location. This can be
considered bottom-up, since it targets a specific item of data. In this
case, the IP is not certain about what the IS's ultimate goal is.
We consider the IP to be an expert in both domain information and visual
presentation and the IP's knowledge is canonicalized in a form of
reactive patterns. Instead of deliberately reasoning about what to present
every time the user asks a question, the IP simply reacts to it by using
canonical presentation techniques.
Based on this model, we have developed: (1) a knowledge representation
scheme for representing domain knowledge together with visual design
knowledge, (2) a computational mechanism whereby the system reacts to a
series of user requests while maintaining overall context, and (3) a
learning mechanism that enables the system to be molded according to user
profiles, or to particular projects.
There have been approaches that use queries coupled with graphical displays
both for narrowing down information to be presented [2][8] and for
supporting users' exploration of the data space [6]. The information
seeking model used in GeoSpace emphasizes the latter in its purpose.
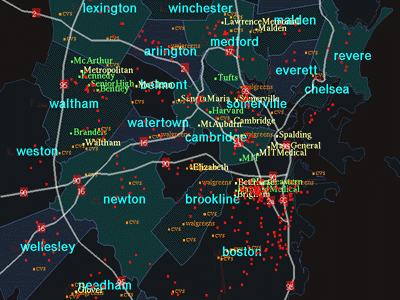
This section presents GeoSpace--a prototype system which embodies the
information visualization technique proposed in this paper. Figure 1 shows
a snapshot of the initial state of the display. The visual complexity of
this map display makes it hard for users to discern specific information
while interacting without getting lost. GeoSpace allows the user to
progressively ask questions in order to acquire appropriate information.
FIGURE 1.
Map of Boston area showing the dense nature of the display.
GeoSpace provides users with two types of interaction. First, the user can
use text or speech to enter a query to which the system responds using the
mechanism described above. Second, the user can use the mouse to zoom, pan,
and move around the two and three dimensional map display.
The following is a scenario in which a person new to the Cambridge area
tries to explore the information around the area (e.g., looking for a place
to live). Having heard of the perilous life styles of people in Cambridge,
suppose that the person is interested in relative crime level and
accessibility to hospitals in the neighborhood.
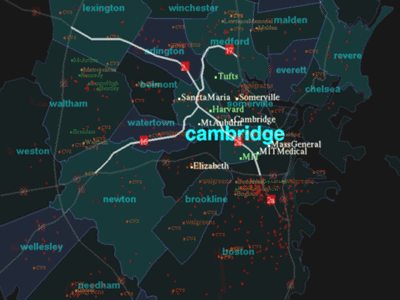
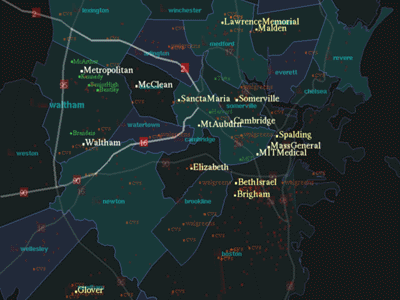
First, the user asks the system "Show me Cambridge." Then, the label
Cambridge increases in opacity to bring this information to the user's
attention (Figure 2). The typographic size also changes accordingly,
resulting in a sharper focus of Cambridge. Notice also that related
information such as hospitals, highways and colleges around Cambridge are
also identified visually to a slightly lesser degree. This demonstrates the
reactive nature of discerning information rapidly in a visually dense
environment.
FIGURE 2.
"Show me Cambridge."
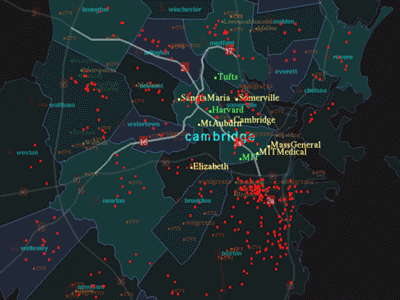
The user then asks, "Show me crime data." This shows a spatial
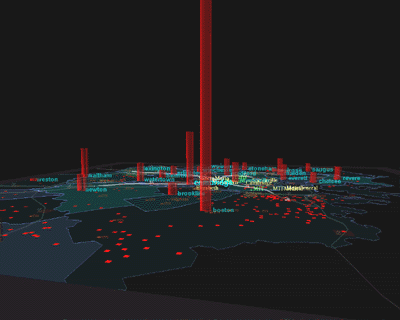
distribution of crime data for the greater Boston area (Figure 3). By
rotating the plane of the map, the user obtains a three dimensional view of
crime data in the form of a bar graph as shown in Figure 4. GeoSpace
currently treats crime data as a unit of information. However, it is also
possible to construct the domain knowledge such that the crime data is
broken down into finer units. This type of decision is important when
designing an application.
FIGURE 3.
"Show me crime data."
FIGURE 4.
Three dimensional view of Figure 3
After looking at crime data, the user found that there are fewer crimes
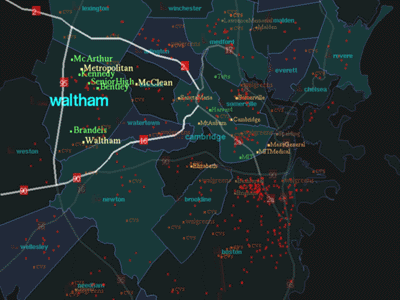
around Waltham and asks, "Show me Waltham." The label Waltham and
other information relevant to Waltham, such as highways, hospitals and
schools, increase in opacity. The typographic size also changes accordingly
(Figure 5). While providing information on Waltham, GeoSpace still
distinguishes Cambridge from other regions in the map about which
information was not sought. This is accomplished by a gradation in
transparency between Cambridge and other areas of the map. This
demonstrates the feature of maintaining the previous context using
translucency.
FIGURE 5.
"Show me Waltham."
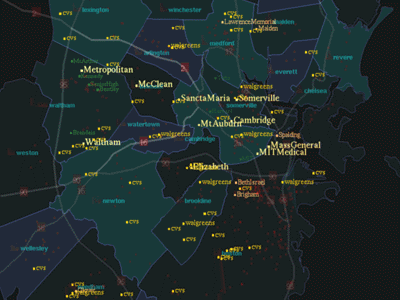
Now, the user is interested in hospitals and asks, "Show me
Hospitals." All the hospitals are indicated by employing the visual
techniques discussed above (Figure 6). Imagine the user's expectation of
seeing pharmacies was not realized by the system. The user can then
explicitly change the system to a learning mode and say "Show me
pharmacies too." Then, the system behaves as it would when asked to
display pharmacies (Figure 7). Furthermore, it will have learned the
relationship between hospitals and pharmacies. Thus, if the user asks,
"Show me hospitals" in future interactions, the system would display
hospitals and pharmacies simultaneously. This demonstrates the ability of
the system to adapt to a user's preferences.
FIGURE 6.
"Show me hospitals."
FIGURE 7.
"Show me pharmacies"
GeoSpace is implemented in C++ and GL graphics language on a Silicon
Graphics Onyx workstation with Reality Engine graphics.
Our approach incorporates domain knowledge and presentation
knowledge together in the form of presentation plans, and uses an
activation spreading network technique to determine relevant presentation
plans to be executed. The reactive nature of the activation spreading
network, combined with visual design techniques, such as typography,
transparency and color, enables the system to support the information
seeker to explore the complex information space. The following section
describes the components that constitute the proposed approach embodied in
GeoSpace.
Information seeking goals and presentation plans are the basic components
of GeoSpace. A plan consists of a list of sub-plans, a list of conflicting
plans, and a list of effects. The effect-list contains a set of goals that
are achieved by executing the presentation plan. The sub-plan list contains
a set of goals that must be achieved in order to accomplish goals in an
effect-list. The conflict list contains a set of goals that are either
semantically irrelevant or visually conflicting with the plan. Since our
interest is to determine what the user is interested in, it is important to
recognize when a subject of interest changes. Knowledge about semantic
conflicts helps the system to identify a shift of interest. When a large
amount of data exist in a database, it is often the case that the same
visual features (such as color, typeface, orientation, or motion) are used
by more than one visual element. Knowledge about visual conflicts helps the
system to identify visually confusing situations.
Figure 8 shows typical presentation plans. Plan (a) says, in order for a
user to know about transportation, a user must know about bus routes,
subways, and place names. The plan also indicate that hospitals and
bookstores are not relevant when a user wants to know about transportation.
In the current representation semantic and visual conflicts are not
distinguished. Plan (b) is much simpler; it has neither sub-plans nor
conflicts. The activation level specifies the threshold energy required to
realize the plan.
FIGURE 8.
Typical presentation plans
The system uses an activation spreading network [1][9] to determine
priorities of plans based on the user's request. A plan module's activation
level is changed by the user's immediate goals, and when their activation
level exceed the threshold, positive and negative activation energy is sent
to other plan modules connected by hierarchical links and conflicting links
respectively. The current system iteratively injects a small amount of
constant energy to fluidly change the overall activation state. In every
iteration, activation levels of all the plan modules are normalized to the
most active plan. This also results in the gradual decay of plans whose
links are not explicitly specified.
For example, when the user specifies a query such as "Show me
transportation", know_transportation becomes the current information
seeking goal. The system then injects activation energy to the plans that
contain know_transportation in the effect-list. When a plan module's
activation level reaches a certain threshold, it spreads energy to the
plans in the sub-plan list. A plan also spreads activation energy upwards
to the higher level plans that contains know_transportation in their
sub-plan list. This upwards activation results in activating indirectly
related information. Figure 9 shows a simple example of an activation
spreading process.
FIGURE 9.
Schematic diagram of typical activation spreading
An activation spreading network not only presents the immediately relevant
information, but it can also preserve the user's previous states of
exploration. When a user requests new information, the system seamlessly
transforms the previous state into the new state. The network can also
prepare for the user's future request by activating plan modules that
are potentially relevant in the following interactions. This could greatly
assist users to formulate subsequent queries towards satisfying a
particular goal.
The map display involves many layers of information each of which
corresponds to a different set of data. The system is intended to
incorporate various visual techniques, such as translucency and focus which
helps clarify visual information without losing overall context [5][13]. We
have incorporated these new techniques along with traditional graphical
design techniques in the design of the map display. In the current
implementation, translucency is particularly important in visually
organizing the dense information space without losing a larger context. The
most important information is displayed with a higher level of opacity, and
related information is displayed with medium translucency. Irrelevant
information is displayed almost transparent. Since, the display can show
secondary information using translucency, the user has a chance of
realizing a new question to ask next. Also, previously displayed
information can be shown with medium to high translucency so that the user
can maintain a continuous dialogue.
Plans may or may not have a graphical presentation. For example, a plan for
highways does not have a graphical representation, but each highway has a
graphical representation. Those plans that have a graphical representation
change their graphical style according to their activation levels.
Currently, the energy levels are mapped to transparency values and/or
typographic sizes on the cartographic display. The mapping from the
activation levels to graphical styles is achieved by simple procedures that
are implemented according to design principles. In other words, visual
design knowledge is embedded in those procedures and presentation plans.
Thus, the quality of visual presentation, such as legibility, readability,
and clarity are significantly enhanced.
In the map display, much of the spatial layout of the various graphic
elements was inherently determined by geographic location. But when large
amounts of information are involved, the layout often becomes a serious
design problem. We did not use cartographic layout algorithms in GeoSpace;
rather, we took an alternative approach that incorporates a mechanism that
prioritizes information, and a set of dynamic visual techniques in order to
avoid the complex layout problem.
GeoSpace incorporates a simple learning mechanism in order for users to
customize the domain knowledge. This is important since the initial domain
knowledge is constructed by a particular designer and in some cases the
system might behave in ways that do not reflect users preferences. The
learning mechanism allows the user to personalize the response of the
information display. Consider the user who wishes to see hospitals but the
system does not know to show pharmacies when hospitals are requested. In
other words, know_pharmacies is not included in a sub-goal list of
the plan to show hospitals. In such a case, a user may want to customize
the system so that the system can associate pharmacies and hospitals for
future interaction. In the current system, the user must explicitly tell
the system what to learn. The system accomplishes the above task by adding
the goal know_pharmacies to the sub-plan list of the plan to show
hospitals. However, an ideal system should be able to detect a user's
interaction patterns and automatically learn that pharmacies are associated
with hospitals. The current implementation does not have a mechanism to
detect users' interaction patterns. Statistical methods to identify a
user's interaction behavior is currently being explored to enable implicit
learning capabilities.
Currently, our approach has been examined in the domain of geographic
information. We intend to explore other domains that involve more abstract
information, such as online news and financial data. In order to further
examine the power of this technique, we are also increasing the size of the
current database by adding more data.
Currently, the domain knowledge base is built manually by a designer.
Further research will include the development of (1) a graphical interface
for building domain knowledge and (2) a mechanism that automatically
constructs the initial domain knowledge base for certain types of
information provided that presentation plans can be implied from the
database.
The activation network is fairly sensitive to the amount of activation
energy spread. This will control the pace of the transitions from one
display to another; hence, it is important to determine the optimal
activation values. We are experimenting with varying energy levels to find
the optimal network.
Finally, we are experimenting with the use of weighted links [9] for the
activation spreading network to employ an implicit learning mechanism.
While the current explicit learning mechanism provides rapid adaptation,
implicit learning will provide a natural means for incorporating users
preference over longer periods of time.
We have presented a reactive interface display for interactively exploring
complex information spaces. We have shown that the knowledge representation
scheme using presentation plans and information seeking goals, combined
with the activation spreading network, provides the information display
with a reactive capability. The mechanism can implicitly chain presentation
plans by hierarchically spreading activation energy, and can respond to an
immediate shift of interest by spreading negative energy to conflicting
plans. The system can also direct a user's attention in a fluid manner
without losing overall context, by gradually changing the states of
activation. Dynamic use of various visual techniques, such as translucency,
type size and color, are directly associated with activation levels of
plans and visually clarify the display. We have also presented a learning
mechanism as an integral part of the system, which allows users to
customize the information display. These features make a user's exploration
of complex information spaces a more dynamic experience.
We would like to thank Prof. Muriel Cooper, Ron MacNeil, and Dave Small for
their continued support and advice at all times during the course of this
project. Special thanks to Prof. Whitman Richards, Louis Weitzman, Hasitha
Wickramasinghe, and Yin Yin Wong for commenting on drafts of this paper. We
would also like to thank the other members of the MIT Media Laboratory's
Visible Language Workshop for providing valuable suggestions as we
developed our ideas.
This work was in part sponsored by ARPA, JNIDS, NYNEX and Alenia. However,
the views and conclusions expressed here are those of the authors and do
not necessarily represent that of the sponsors.
Abstract
Keywords:
Interactive techniques, intelligent interfaces, cartography, multi-layer, graphics
presentation, activation spreading network
1. Introduction
2. USER INTERACTION MODEL
3. A TYPICAL SCENARIO
4. APPROACH
4.1. Domain Knowledge
4.2. Activation Spreading Network
4.3. Visual Design
4.4. Learning Mechanism
5. FUTURE DIRECTIONS
6. CONCLUSIONS
ACKNOWLEDGEMENTS