
Marita Franzke*
Institute of Cognitive Science
University of Colorado, Boulder, CO 80304
*The author can now be reached at:
U S WEST Technologies,
4001 Discovery Drive, Boulder, CO 80303
e-mail: mfranzk@advtech.uswest.com
At present, a growing number of users of new software are
computer-literate. These users will have used a variety of
computer applications before encountering a new one, and
are therefore more likely to attempt learning new
functionality by exploration rather than by reading manuals
and tutorials [13,14]. These discretionary users of systems
may also use systems sporadically, since many applications
support very specialized functions that are not needed every
day. Graphing applications are one example of these
specialized systems. If applications are only used
occasionally, retention of once discovered functionality
comes to be a usability issue. Hence, two activities,
discovery and retention of functionality, are two important
characteristics of discretionary use of software.
This means that design of application software should
support exploratory activities of computer literates, even for
applications that are more complex than the often cited
example for walk-up-and-use systems, ATM-machines.
Secondly, interfaces should provide ample cues to casual
users, so that once-discovered functionality can be easily
remembered or rediscovered after a longer interval of non-
use.
Graphical user interfaces (GUI's), or display-based
systems, in our terminology, were once hailed to solve
these two problems of explorability and retainability simply
by way of displaying relevant information to the user [e.g.
15]. Early empirical work, however, showed that
exploration of display-based systems may be difficult, if not
impossible, at least for novice users [2]. A cognitive model
of explanatory behavior with computer systems will help to
explain why these computer users failed to discover
important functionality.
Polson & Lewis's [11, 12] CE+ addresses the problem of
explorability of interfaces in the framework of a theory of
problem solving. It is assumed that task-centered
exploration of a new interface is guided by general task
goals, such as "make a new graph from the data in
spreadsheet". Having formed such a goal, users will search
the interface for an object that promises progress towards
that goal. This search is guided by label-goal matches. If
an interface object (such as a menu item, a button, or an
icon) displays a label that matches the goal (for example,
'graph', or 'chart'), users will select it, given that they
know how to take an action on this particular object. After
executing an action, users evaluate the system feedback. If
they conclude that they made progress towards their goal,
the search-action cycle continues, until they have
completed their goal in this manner.
There is empirical evidence for both, the importance of
well-matched labels [e.g., 4], as well as the importance of
differentiating and recognizing interface objects, and
knowing which actions are available on them [2].
The CE+ theory identifies four critical points at which the
exploratory search can fail: (1) Users can form an
inadequate goal, (2) they might not find the correct
interface object (because of poor label match), (3) users
may not know how to execute an action on the relevant
interface object, and (4) they may receive inappropriate and
misleading feedback. The experiment reported here
focuses on points two and three. It asks whether the
discovery of the appropriate interface object is also
dependent on the number of distracting interface objects,
and on the type of action that will be necessary. In
particular, its aim is to identify whether the goodness of the
label, the type of action, and the number of interface objects
interact. The result of the experiment should lead to a
refinement of the model of the search process.
Several empirical studies have shown that recall of
important parts of display-based interfaces is poor even for
frequent users of these system, who can demonstrate
virtually flawless performance in using these same features
in the context of the application [9, 10]. Theoretical
accounts of display-based interaction are therefore based on
the assumption that recognition rather than recall of
commands and interface objects drives the interaction [e.g.,
7, 8, 10]. The experiment described here compares
performance at a short and a longer retention interval. This
will answer the question of whether display-based computer
skill is indeed robust against forgetting. It also concerns
itself with the question of whether the particular design
features listed above (label match, number of interface
objects, and type of action) will have an effect on the
retainability of particular interactions.
The cognitive theory of Polson and Lewis [11] discussed
above has previously been extended into a method for the
evaluation of walk-up-and-use interfaces, the cognitive
walkthrough [12, 17]. This method helps interface
designers and engineers to evaluate a system or system
specification by decomposing various user goals into chains
of interface actions (such as menu selections, button
presses, etc.). For each goal and for each action in
accomplishment of a goal, the evaluator considers a series
of criteria, derived from the four-step cognitive model: (1)
whether the user will have trouble forming an appropriate
task goal, (2) whether an action is clearly available and
whether the label associated with the action matches the
users' representation of the task goal, (3) whether the user
will know how to execute an action, and (4) whether the
system feedback is clearly interpretable.
The method has been introduced into industrial use and has
received various criticisms in the literature [e.g. 16,17].
Most of these reviews center on procedural aspects of the
method which have been taken into account in newer
versions of the cognitive walkthrough [17]. Some other
criticisms concern the methods' ability to detect a broad
range of usability problems. One of the points brought
forward [16] is that the method is too narrowly focused on
identifying linguistic difficulties, namely mismatches
between the users' (linguistic) representation of a task goal,
and the (linguistically expressed) label of the goal. The
method gives little guidance in determining whether a
graphical layout of the screen design is more or less
conducive to finding an important object. Furthermore, it is
difficult to estimate whether a particular interface action (a
button press, for example) will be known to a group of
users. This is especially problematic when the new
application is for a large and relatively diverse user-group.
The experimental results, reported in this paper, by
extending CE+, can also be used to add more specific
evaluation criteria to the walkthrough procedure. In
particular, the results will inform us about how the number
and grouping of interface objects affects search, and will
provide us with information about the relative difficulty of
a range of different interface actions. The results of the
retention trials will also show whether difficulties identified
with the walkthrough procedure will only be problematic
during exploration or also for application after longer time
delays. This information will be integrated into the
walkthrough in the discussion section.
In the experiment, familiar users of Macintosh systems
learned a new application, one of four graphing systems
(see below). They were asked to create a graph and do
several modifications to the default graph that the system
brought up. The subjects participated in two of these trials,
each time with different data and superficially different
modifications. The first of these trials was the exploration
trial, here the subjects had to discover the necessary
functions on their own. The second trial (experienced
performance) was administered either after a short (a few
minutes) or a long (one week) retention interval.
Comparison between these two delay conditions allowed
for an observation of the effect of forgetting on
performance.
Thirty-three males and forty-three females participated in
this experiment. The subjects had an average of 2.8 years
of Macintosh experience, and were familiar with an average
of 3 different Macintosh applications. The majority of
subjects (72%) had additional experience with PC's. On the
average, subjects had 1.6 years experience with PC's, and
knew 1.8 PC applications. None of the subjects had used
any graphing applications before. The age range was 15 to
44 years, with an average of 25 years. Subjects were paid
$15 for participation. The data of four subjects were
excluded from the analysis, because of failures to complete
the task in the exploration phase, for a total of 72 subjects.
Subjects were randomly assigned to one of eight
experimental groups (four interfaces by two delay
conditions). The interfaces were CGI , CGIII , EXC tool ,
and EXC menu . Subjects were assigned to one interface
and used it throughout the whole experiment. Half of the
subjects performed the second (experienced) trial after a
short delay (approximately ten minutes), and the other half
after a long (one week) delay. Subjects worked on a Apple
Macintosh II cx with a 13'' color monitor, set to black and
white. The screen interactions were videotaped over the
subjects' shoulders and an audio-track was recorded.
Tasks: Subjects were provided with a HyperCard stack of
instructions for both tasks. They were told which subgoals
to complete in which order. Specifically, they had to (1)
create a line graph from data in a file provided to them.
Then they received a sample graph and instructions on what
formatting changes to perform to match the default graph to
the sample graph. Subjects were instructed to (2) move the
legend to a different location, (3) change the font size of the
legend text, (4) change the line and symbol style of the
plotted graph, (5) change the font and style of graph title,
(6/7) change the font and style of both axes, and (8/9) edit
the title and x-axis title content. The instructions provided
subjects with detailed information on what to do, but no
hints on how to accomplish it. The tasks in the exploratory
and experienced session were isomorphic, but subjects were
provided with different sets of data and different sample
graphs in both cases. The instructions, and sample and
default graphs were identical in all interface conditions.
The instructions were provided in a HyperCard stack,
which overlapped with the application window. If the
subjects wanted to read the instructions, they had to click
on the stack to bring it to the front (see FIGURE 1). This
procedure allowed us to account for the time subjects spent
in reading the instructions.
FIGURE 1
Example of instruction card.
Procedure: On arrival, subjects filled out a brief
questionnaire about their computing background. After this
they completed a simple editing task in which they were
warmed up to the window switching procedure involving
the instructions. They then started the first graphing task.
The experimenter stayed in the room with the subject
during these tasks and provided brief, action-oriented hints
if subjects had not made any progress toward the next
correct action for more than two minutes. After
completion, half of the subjects received another editing
task (as distracter), and the second graphing task (the
experienced trial). The other half of the subjects did these
two tasks (the second editing and graphing tasks) one week
later.
For each correct action step in fulfillment of the tasks we
will report on the action time (time to find the correct action
- time to view instructions) and number of hints needed.
The results are reported in two sections: First, global
results that concern overall performance measures are
summarized. Second, results from the detailed analyses are
reported. In that section a description of the coding of the
design parameters and their effect on the subjects'
performance is given. A more complete set of analyses can
be found in [6].
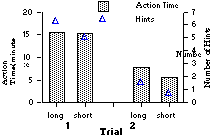
Effects of Training and Delay: Mixed two-factorial
MANOVA's (trial, repeated; condition, between-subjects)
with a covariate controlling for Macintosh experience were
performed on action times and the number of hints. See
FIGURE 2 for an illustration of the group means underlying
these analyses.
There was a main effect of trial for action times (F (1,59) =
95.83, p.<.01) and for hints (F(1,54) = 63.76, p.<.01).
Subjects' performance showed a sharp improvement
between the first and the second trial across interfaces and
delay conditions (see FIGURE 2). Overall, subjects were
able to cut their action times in half, from an average of
about fifteen to an average of about seven minutes for the
whole task. This results shows that interface literate users
were able to discover functionality in a new system in a
reasonable amount of time, without extensive use of
external help, and were able to use the discovered methods
efficiently in a second trial.
There were no significant main effects for delay for action
times (F(1, 59) = .24, p. > .05), nor for hints (F(1, 54) =
2.21, p. > .05). However, the interaction between trial and
condition was significant for action times (F(1, 59) = 4.64,
p. < .05). This result shows that the overall performance
time decrease was influenced by the delay. The
performance time decrease was smaller when the second
trail happened after a one week delay (see FIGURE 2).
There was no significant interaction between trial and delay
condition for the number of hints (F(1, 54) = .15, p. > .10).
These results indicate that while learning effects are strong,
as can be expected on the background of theories of skill
acquisition [e.g., 1], forgetting plays a surprisingly little
role for performance with display-based systems. If users
have not used a new system for a longer time period, they
need more time to perform the same tasks. However, the
observed forgetting effects are relatively small when
compared to the large savings between the first and second
trial and their significance could be debated on practical
grounds. In a previous study that investigated performance
on a transfer task, we had found that forgetting may play a
role only in complex interactions, but not in simple ones
[5]. The analyses reported below investigate the exact
locus of the delay effects, and try to relate the difficulties in
exploration and the observed forgetting effects to several
design parameters.
Overall performance analyses also showed significant
differences between the four systems, but these differences
disappeared, when the number of action-steps for the task
were controlled for [6].
FIGURE 2. Effect of delay on second task. Long = one
week delay, short = ten minutes delay between first and
second task.
If the current task artifact analysis is to inform further
designs of display-based applications, we need to refine our
level of analysis. For any type of design recommendations
we need to know which type of interactions were difficult
to discover during the exploration phase (first task), and
which interactions were responsible for the forgetting
effects observed in the global results.
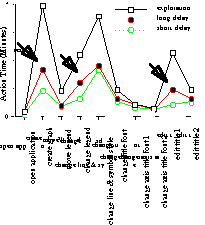
Analysis by Subgoals: To answer these questions, the
analysis was first taken to the level of subgoals. For this
level of analysis we will only report results for the action
times to reduce complexity in the presentation.
Simple ANOVA's on action times associated with trial 1
(exploration) and on differences between the delay
conditions on trial 2 show significant effects due to
subgoals, F(9,630) = 49.00, p. <.01) for exploration times
and F(9,621) = 3.41, p. <.01) for the differences between
delay conditions. For an illustration of this effect see
FIGURE 3. Separate analyses of variance were performed
on the overall action times associated with each subgoal,
testing whether there were differences between the two
delay conditions. The arrows in FIGURE 3 point to the
subgoals where delay differences were statistically as well
as practically significant, F(1,70) = 13.27, p. <.01 for
'create graph', F(1,70) = 11.15, p. <.01 for 'change
legend', and F(1,70) = 10.95, p. <.01 for 'edit title 1'.
FIGURE 3. Action times during task 1 (exploration) and
task 2.
Arrows indicate significant delay effects.
An inspection of the graph in FIGURE 3 illustrates that
these subgoals were also associated with particularly long
exploration times. All three subgoals introduced situations
in which subjects had to discover and learn a completely
new method. They had never created a graph before, they
had to acquire a general method for modifying objects in
the graph (change legend) and they had to discover another
method for editing text associated with graph objects.
Along these lines we suggest that long exploration times
and some forgetting effects due to long retention delays
may appear in situations where completely new methods
need to be discovered. In all other subgoals where transfer
of old (move) or newly learned methods (e.g. change title
font) were possible, exploration times were lower, and no
forgetting due to the delay appeared. One exception to this
rule appears to be the subgoal 'changing line and symbol
style', where performance on the second task was very poor
for both conditions.
Analysis by Action Steps: To determine exploration and
retention difficulties further, the analysis was finally taken
down to the level of individual action steps. For this, we
included individual action steps that comprised the three
subgoals of interest in the regression analyses described
below. FIGURE 4(a/b) provides an example for the level
of detail of this analysis. FIGUREs 4a displays the first
action step for the subgoal 'create graph' for Cricket Graph
III: select menu-bar item 'graph'. FIGURE 4b shows the
second action-step: select menu-bar item 'new graph'.
For each action step (e.g. 'click on menu-bar item 'graph'',
FIGURE 4a) three variables were encoded, (1) the type of
action, (2) the semantic distance between goal and label,
and (3) the number of objects competing for attention. For
the type of action we recorded what type of interaction
needed to be performed by the subject (e.g.: menu bar
selection, button click, move operation, tool selection, etc.).
FIGURE 4. First two action-steps to create a graph in
CGIII.
For the semantic distance it was assumed that subjects
represented their active goal in terms of the task
description. For example, if the assumed goal was to
'create a graph', then a menu item with the label graph' was
defined as semantic difference of 0, a menu item with the
label 'chart' as a value of 1 (for synonym), the label
'drawing tools' as a value of 2 (semantically related, but
inference required), the label 'file' received a value of 3 (no
direct semantic link, connection has to be learned). Finally,
for the objects competing for attention, each object in the
relevant object group was counted, as well as the number of
competing object groups (e.g. for FIGURE 4a: 0 competing
menu items (greyed out) + 1 for the menu bar + 1 column
labels in spreadsheet + 1 for spreadsheet entries = 3).
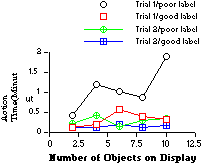
Exploration and Experienced Performance. The design
parameters derived above were used in three sets of simple
and multiple regressions, to explore their effects on the
action times. Details on these analyses and their results are
reported in [6]. Here, we will focus on the illustration and
discussion of the significant effects.
Abstract
This research investigates how several characteristics of
display-based systems support or hinder the exploration and
retention of the functions needed to perform tasks in a new
application. In particular it is shown how the combination
of the type of interface action, the number of interaction
objects presented on the screen, and the quality of the label
associated with these objects interact in supporting
discovery and retention of the functionality embedded in
those systems. An experiment is reported which provides
empirical evidence for Polson & Lewis's CE+ theory of
exploratory learning of computer systems [11]. It also
extends this theory and therefore leads to a refinement of
the cognitive walkthrough procedure that was derived from
it. The study uses an experimental method that combines
observations from realistically complex task scenarios with
a detailed analysis of the observed performance.
Keywords:
exploration, retention, display-based systems,
direct manipulation, cognitive theory, cognitive
walkthrough, experimental method.
Introduction
Researchers agree today that learning by guided
exploration, is not only a preferred mode of knowledge
acquisition, but also one of the more successful ones [3,13].
The study reported here builds on this assumption and
investigates the process of task-oriented exploration at a
small grain size. It asks how design decisions embedded in
commercially available display-based systems assist in
exploratory search, how exploratory performance is related
to forgetting, and how systems could be designed to support
exploration and retention better.
Characteristics of discretionary use of software
Exploration
Retention
Turning research into practice I: the cognitive
walkthrough
Overview of the study
METHOD
Subjects
Design and Materials
Task and Procedure

RESULTS
Global Results
Detailed Analyses and Results